
Build Analytics Prototypes at the Speed of Conversation
How Claude Artifacts is Transforming Data Visualization

Generative AI has disrupted many fields, from content creation to coding, from graphic design to stock image photography. Until recently, analytics appeared to be one of the fields least affected by these advancements. Unlike text-based tasks or software development, where generative models have made waves, the role of GenAI in analytics seemed limited to improving existing workflows, not redefining them.
But that perception is shifting thanks to the AI's ability to write code on their own to interact with data. The latest tools are starting to develop capabilities to make them useful for data analysis, opening new doors for innovation. One such tool is Claude with its Artifacts feature, which brings generative AI capabilities into the realm of visualization and exploratory data analysis. By simplifying the creation of custom visualizations and solving niche problems, tools like this hint at the broader potential of AI in analytics.
In this post, we’ll explore how Claude Artifacts fit into this evolving landscape, showcase practical use cases, and discuss its limitations.
What Are Claude Artifacts?
While I used Claude rather extensively, I figure there is an ultimate authority on this topic. So here is Claude itself explaining what Artifacts are:
Claude Artifacts are interactive components that transform data and ideas into polished outputs - from visualizations and code to documents and diagrams. They're unique because they're created and modified through natural conversation, with no setup required beyond your browser. Whether analyzing data, prototyping visualizations, or building interactive tools, Artifacts serve as a collaborative workspace where ideas can be quickly tested and refined.
How Claude Artifacts Simplify Data Visualization
Claude Artifacts eliminate the traditional barriers to creating visualizations. Analysts can upload a CSV file, a PDF, or a screenshot, and prompt the AI to generate visualizations within seconds. The process is intuitive, requiring no additional setup or coding - everything is happening in the same browser tab (or mobile app). Whether you’re visualizing a single metric or exploring a statistical concept, Claude delivers interactive visuals in a matter of seconds, making it a powerful ally for quick data exploration and communication.
Instead of spending hours coding in Python or configuring dashboards in Power BI, analysts can use Claude Artifacts to create proof-of-concept visualizations and evaluate ideas quickly.
Real-World Scenarios for Claude Artifacts
How can Artifacts help you in your day job in analytics? Here are three real-world use cases that give you an impression of why Claude can be a game-changer.
Scenario 1: Create proof-of-concept for new visuals
Every so often, you have a new idea for a dashboard visual and want to test its utility before committing time to implementation. Claude makes this process effortless. For instance, if you want to plot a cohort retention matrix, you can simply ask, “Can you create a sample visualization for cohort analysis?” and receive a useful example:
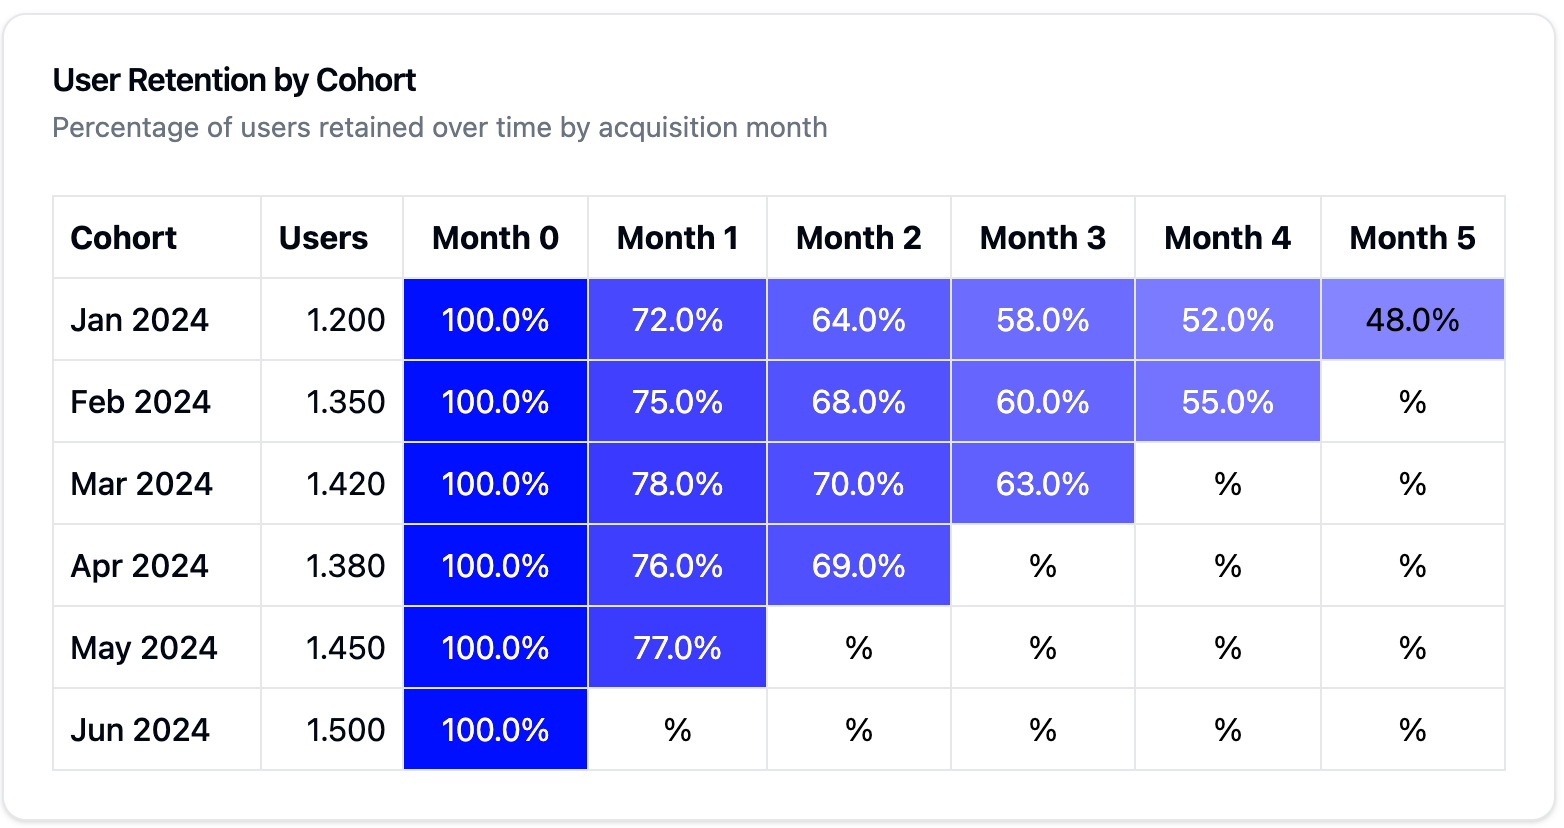
While you could achieve the same result using tools like Power BI or Tableau, the process often involves significant setup; preparing the data in your data warehouse, loading it into Power BI, and creating the visual. In many cases, it’s more about communicating the concept than having it fully built out. This is where Claude shines—providing a rapid and effective way to share and refine ideas.
Scenario 2: Quick A/B test evaluation
You’ve just wrapped up an A/B test and need actionable insights immediately. With Claude, you can input the key metrics from your test, and the AI will generate an Artifact summarizing the results in an accessible format.
For example, imagine you’re comparing conversion rates across two groups and want to highlight statistical significance. By inputting the data into Claude, you get clear visualizations illustrating performance differences and the overall impact of your test:
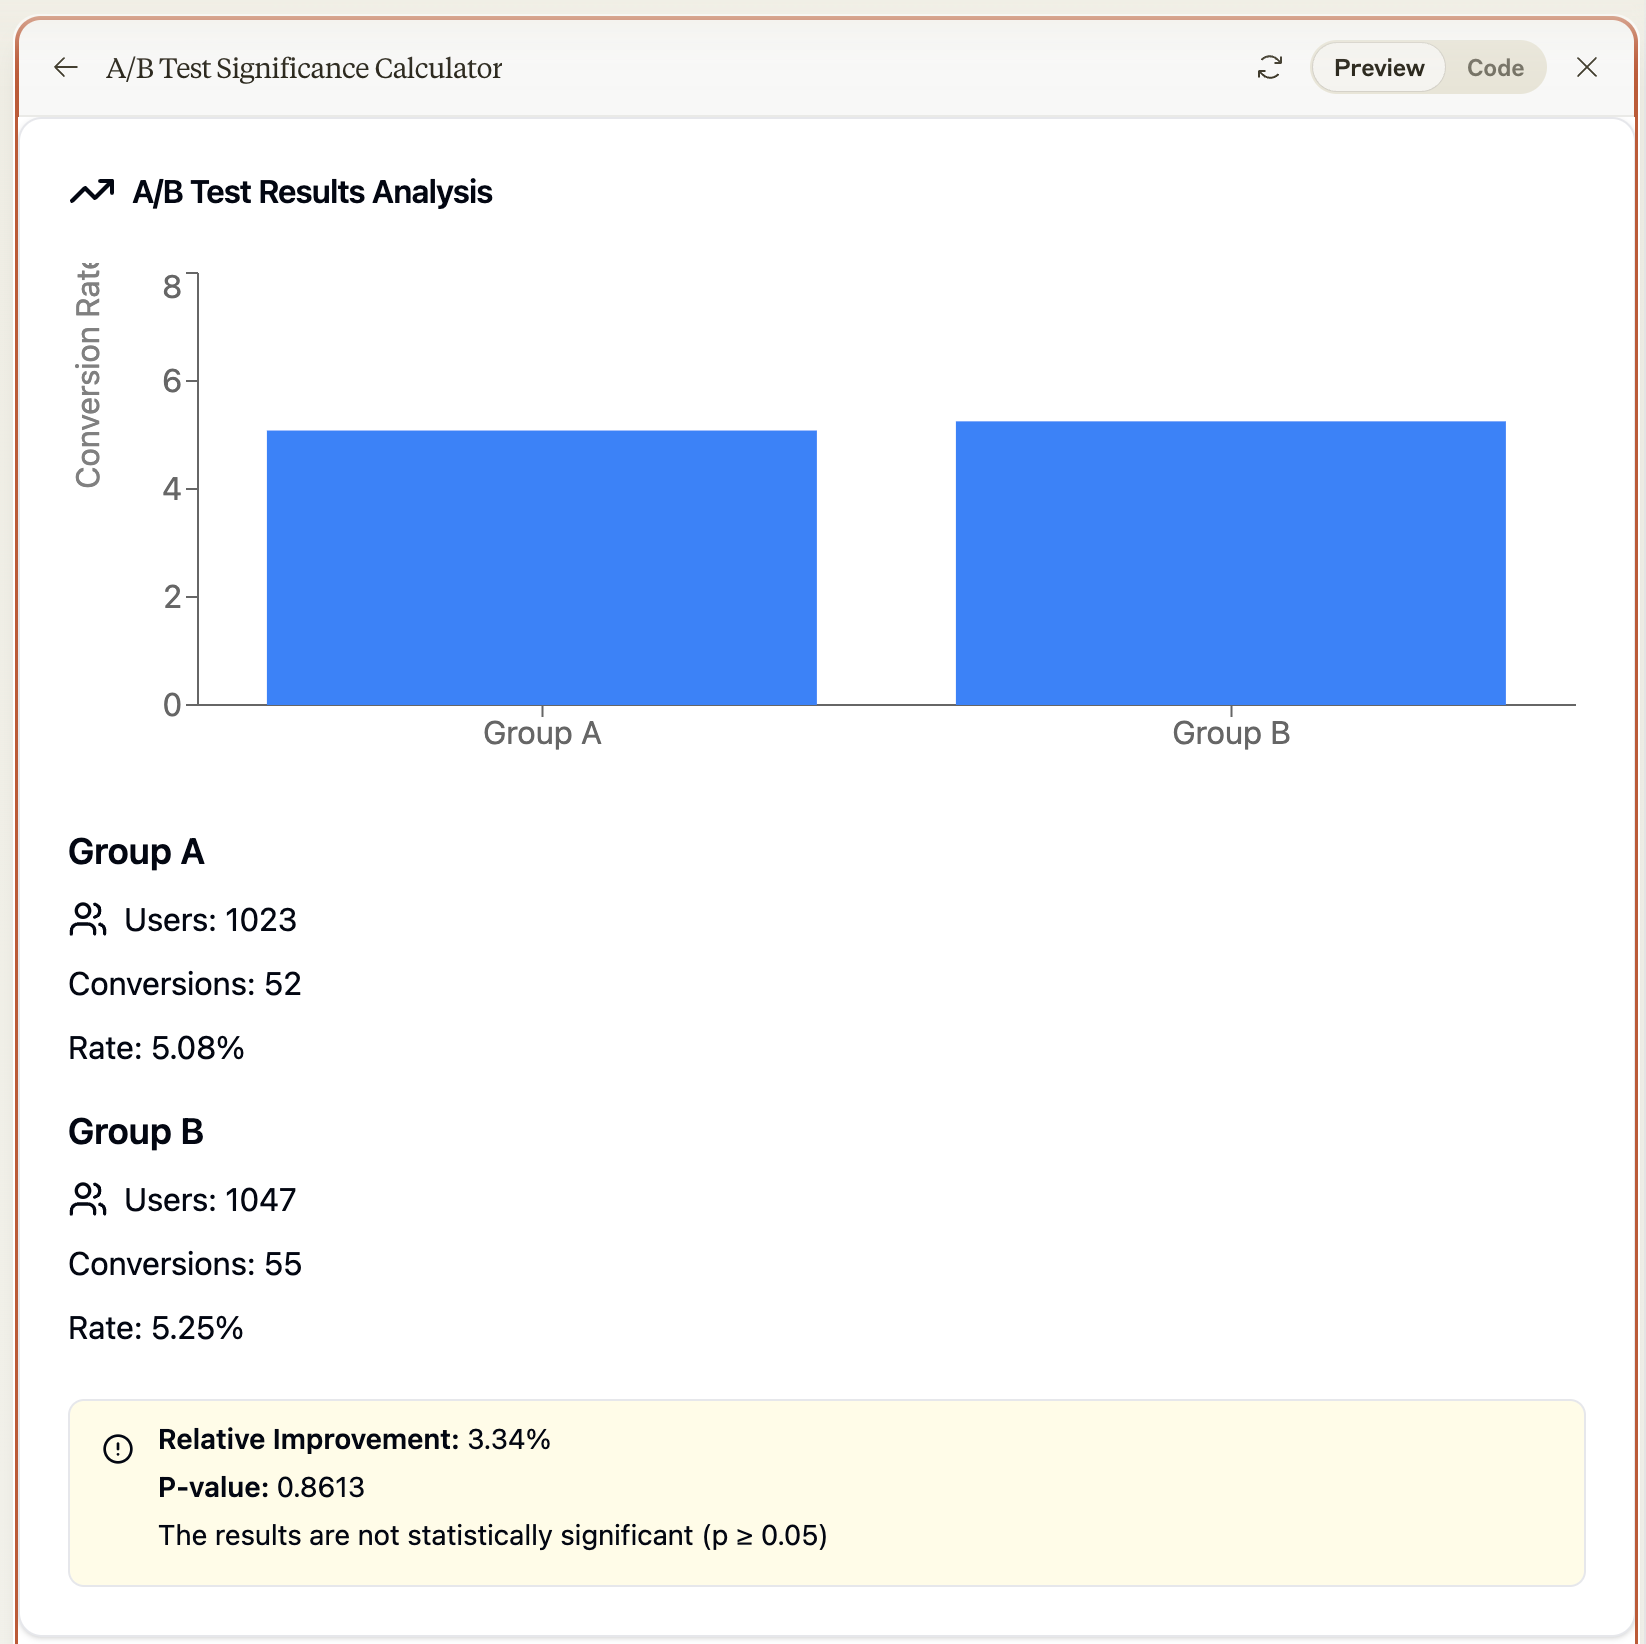
Beyond just speed, the flexibility to iterate on the output—by adding notes or tweaking the visual style—makes Claude an invaluable tool for turning raw test results into actionable presentations. Let's say, you are not a fan of frequentist significance testing, no problem, just ask Claude to switch to a Bayesian approach.
Scenario 3: Draw flow chart diagrams
When introducing new features or integrating data sources, understanding how systems interact is essential. A clear diagram can ensure alignment among all stakeholders. Claude can help here, too. By asking, “Can you create a quick diagram of how a customer data platform (CDP) integrates with BigQuery, Salesforce, Google Analytics, and ad platforms like Google Ads and Meta?” you’ll receive a visual representation in the easy-to-use and easy to customize Mermaid format.
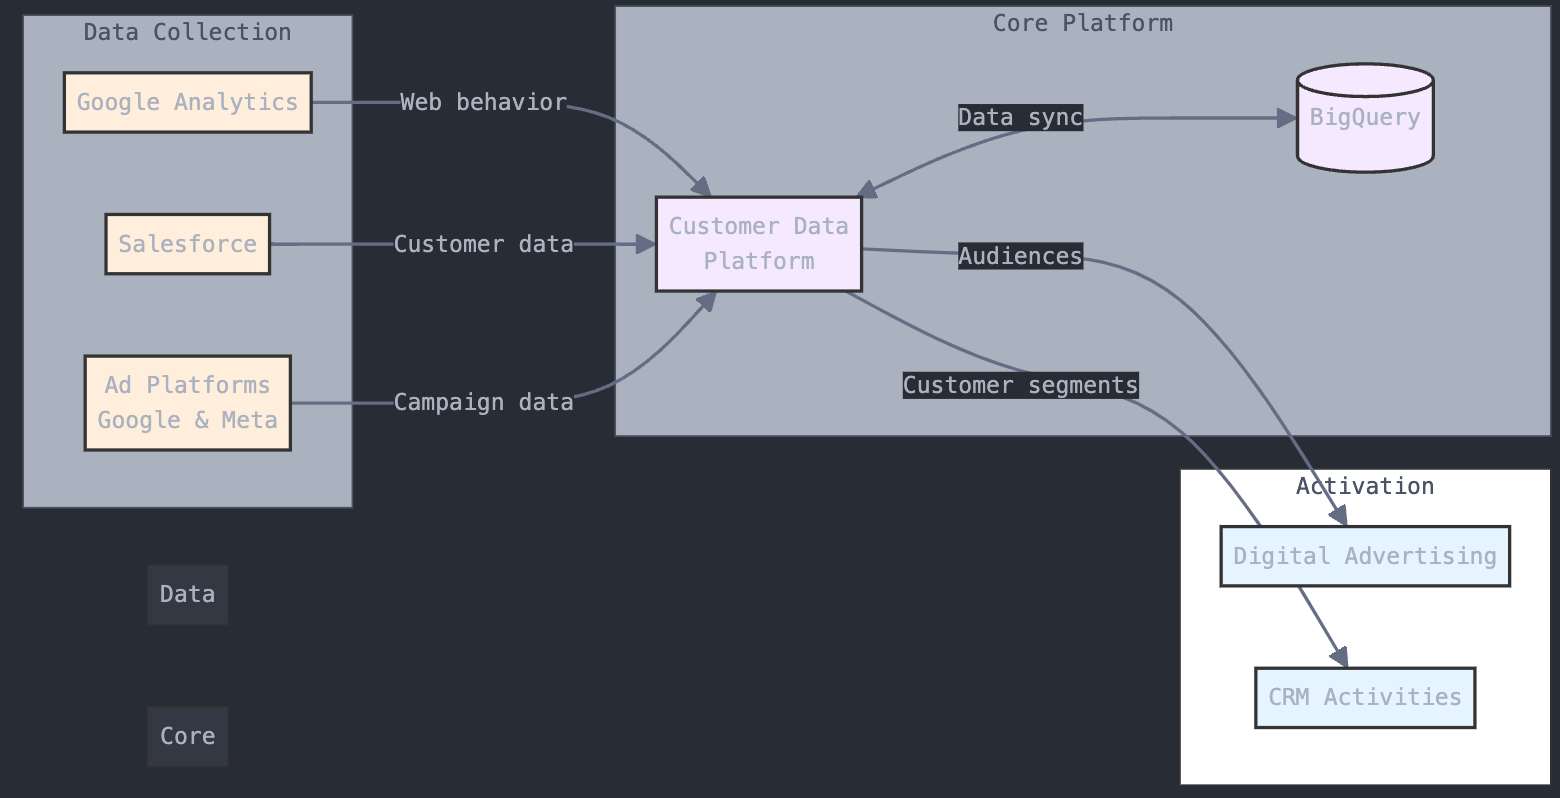
While the output might need refinement, starting with a ready-made draft saves time and facilitates collaboration, especially given Mermaid’s extensibility for further customization.
You’ll notice that working with Claude often requires minimal prompting. Simply state what you need, and the AI delivers results without requiring extensive context or detailed instructions—a level of simplicity that stands out in a busy work environment.
Understanding What Claude Artifacts Can and Cannot Do
While Claude Artifacts are a powerful tool, it’s essential to recognize their limitations:
Not a Replacement for Advanced Visualization Tools: Claude Artifacts are best suited for small-scale, one-off visualizations. They don’t replace tools like PowerBI or Tableau, which support automated data refreshes and production-level dashboards. In my experience, they work best when the alternative is to dump the data into Excel or Google Sheets for quick transformation.
No Automation: Every visualization requires manual input of data via a file or screenshot. There’s no functionality for automatic data updates or integrations, making it less suitable for recurring reports.
Potential for AI Errors: As with any generative AI, the code and insights produced by Claude may contain errors or hallucinations. For complex datasets or advanced statistical methods, it’s crucial to double-check outputs and rely on specialized tools when necessary. When the AI-generated code gets too complex, it can be easier to write the whole thing from scratch instead of error-checking the generated code (especially since Claude generates all code in Javascript).
Sweet Spot for Use: Claude Artifacts excel in scenarios where speed and simplicity are prioritized over depth and automation. They’re ideal for rapid prototyping, proof-of-concept visualizations, and exploratory analysis.
Why Claude Artifacts Are a Game-Changer
Despite their limitations, Claude Artifacts changed how analysts interact with data. By integrating data visualization directly into an AI-driven workflow, the tool allows analysts to focus on insights rather than technical execution. It’s an invaluable playground for exploring ideas and quickly generating compelling visuals that aid decision-making.
And if you look outside of analytics the use cases are endless. You can create fully functional games right within the browser, you can generate React apps that run in the browser and can simply be copied to run on their own, acting as an interactive playground. Visually summarizing shareholder reports, building soundboards, ... the options are endless.